Case 01 of 13
Re-designing a traditional product from scratch
Record
Broke the prior product's revenue record at launch, a direct result of the design-led relaunch.
A company that had investment in an operational pivot to become a creative company and go from buying IPs to developing them, needed to make sure they learned to break their old assumptions
What began as a proof-of-concept intended to challenge executive assumptions became an organization-wide shift in product strategy, org design, and roadmap. The product was relaunched for a new target segment (casual mobile players).
The relaunched product broke the prior version's revenue records at launch — a direct, attributable revenue outcome from a design-led strategic bet.
Playbook move — Reinvent what everyone assumed was fixed.
The full write-up carries the risk that prompted the work, what was actually built, and how the outcome was measured.
50 %
Cut from operating costs, delivering the same output with half the prior headcount.
Design resources were misallocated toward interface-level (UI) work of low marginal value, while a structural gap — missing information architecture — went unaddressed. This produced redundant work and inflated headcount requirements without a corresponding increase in output.
Rebuilt the missing information architecture layer instead of continuing to patch the surface layer, then centralized the team around the corrected structure.
Reduced product design operating costs by approximately 50%, demonstrating the team could deliver the same output with half the headcount it carried the prior year.
Playbook move — Fix the structure, not the symptom.
The full write-up carries the risk that prompted the work, what was actually built, and how the outcome was measured.
80 %
Cut while maintaining output, with the marketing function moved fully in-house.
Ad spend was running through two external agencies. Nobody could confirm it was ROI positive — not the company, not the agencies. The agencies themselves had been asking for tracking access and hadn't gotten it.
I proposed a bounded, reversible test to a business unit stakeholder rather than debating the question indefinitely: pause his agency's spend for a month and watch for negative impact. He ran it, found none, and we killed the spend for his business unit entirely — still no impact. That converted an open question into evidence.
A second stakeholder, in a different business unit, saw the result and independently followed the same move. Between the two: both external agencies were let go, ad management moved in-house to my team, and $200K/year came back to the business with no drop in pipeline.
Playbook move — Unsure if something adds value? Remove it and see. If nothing breaks, it wasn't.
The full write-up carries the risk that prompted the work, what was actually built, and how the outcome was measured.
450+ games
In the portfolio now compared on one shared, vector-based model.
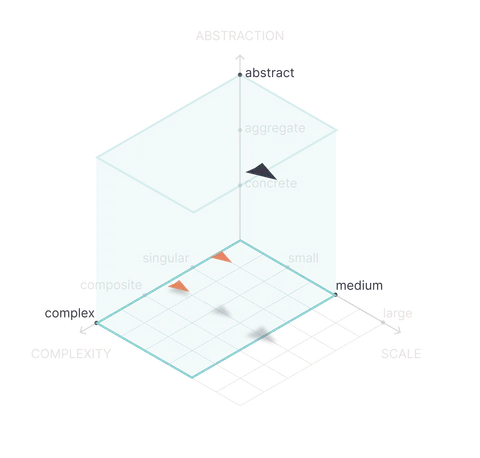
With 450+ games in the portfolio, leadership had no consistent framework to compare user behavior across products or benchmark design decisions — a blind spot for portfolio-level resource allocation.
Led a data visualization initiative applying a vector-based model to normalize behavioral data across the full portfolio, producing a shared visual language for evaluating design performance.
Higher precision in game design decisions and increased efficiency of design and user research investment across the portfolio.
Playbook move — See the portfolio, then place the bet.
The full write-up carries the risk that prompted the work, what was actually built, and how the outcome was measured.
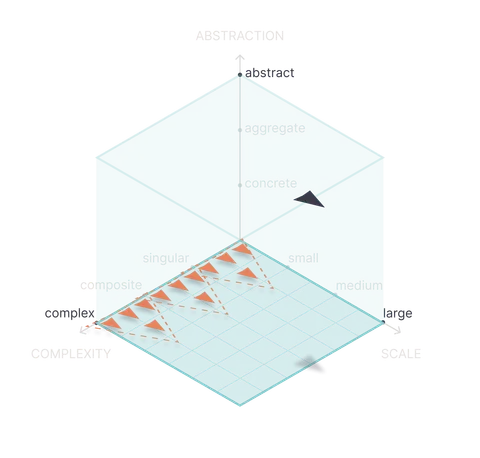
7 teams
Functional teams unified under one reusable design-systems model.
Multiple functional teams (game design, web design, design ops, UX research, creative tech, art direction, communications) were operating without shared standards, making cross-team alignment costly and slow.
Drove department-wide adoption of a design systems model that went beyond UI components, converting every team's output into reusable component and pattern libraries across both horizontal and global capabilities.
Converted one-off deliverables into scalable, reusable assets — reducing duplicated effort and increasing organizational throughput without proportional headcount growth.
Playbook move — Run the org like a design system.
The full write-up carries the risk that prompted the work, what was actually built, and how the outcome was measured.
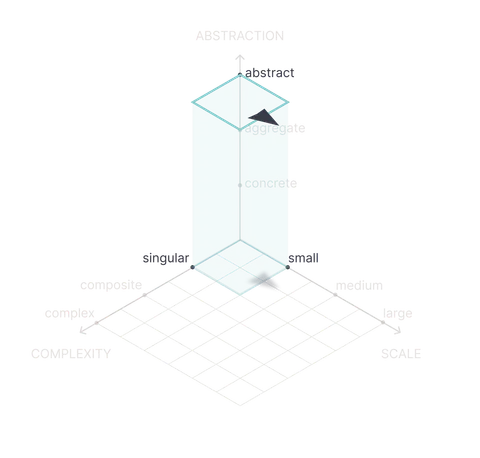
20-30 %
Capacity freed for higher-value work, with no headcount added.
Every new project required its own discovery and mapping process from scratch. This duplicated effort across projects and teams and consumed hours of billable capacity with no reusable output.
Designed a single visual model that consolidated hundreds of use cases and multiple concurrent projects into one standardized deliverable.
Team efficiency increased by an estimated 20-30%, freeing capacity for higher-value work without adding headcount.
Playbook move — Map it once, reuse it everywhere.
The full write-up carries the risk that prompted the work, what was actually built, and how the outcome was measured.
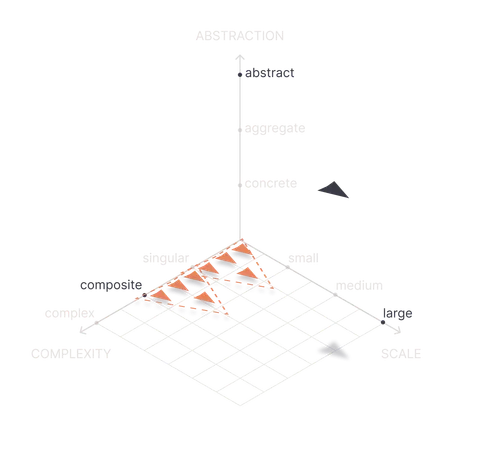
3 ICs
Covering the full creative surface of product and marketing.
Covering both product and marketing creative needs typically requires either a large team or narrow specialization silos, both of which inflate headcount and slow delivery.
Built a small, cross-trained creative team where each member operates across a wide surface of product and marketing work rather than narrow specialization.
Covered the full creative surface area of product and marketing with a fraction of typical headcount. ONly three dedicated ICs covering core design functions like research, content, and UI.
Playbook move — Breadth beats headcount.
The full write-up carries the risk that prompted the work, what was actually built, and how the outcome was measured.
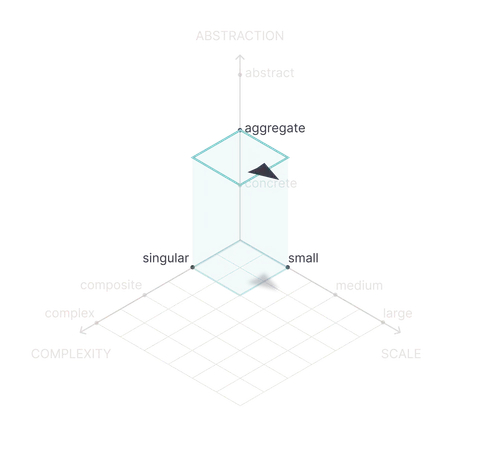
Fewer
Support tickets and onboarding friction, after a shared visual vocabulary replaced ad hoc docs.
Low product adoption among non-expert users represented a direct commercial risk: a technically capable product that only expert users could operate limits addressable market and increases customer support and onboarding cost.
Converted underused internal documentation into a visual taxonomy and shared vocabulary, deployed across every user touchpoint and reused internally to align product, engineering, and design.
Lowered the comprehension barrier to adoption, reducing onboarding friction and support dependency.
Playbook move — Name it, and it becomes usable.
The full write-up carries the risk that prompted the work, what was actually built, and how the outcome was measured.
20 %+
Gains across the product portfolio, from one repeatable 5-step process.
Absence of a repeatable, well-defined process created friction and inconsistent outcomes across product development, design delivery, and cross-functional working sessions.
Implemented a simple 5-step design-thinking process applied consistently across every operating cadence — daily, weekly, phase, and project level.
A more innovative product organization with improved revenue performance and more efficient operations. The company went from buying IP to developing it themselves. Dollar amount is undisclosed, but gains in overall portfolio surpass the 20% mark.
Playbook move — Codify what works so it repeats without you.
The full write-up carries the risk that prompted the work, what was actually built, and how the outcome was measured.
1 yr
To create the conditions for a company-wide, design-led product reorganization.
Limited understanding of design's function and value among adjacent teams constrained the design organization's ability to grow its scope and influence.
Applied a management-cybernetics approach, systematically running a design-thinking workshop across as much of the organization as possible.
Within one year, this created the conditions for a company-wide product reorganization in favor of design-led practices, and grew the design function's influence, scope of responsibility, and headcount.
Playbook move — Teach your function; the org reorganizes around it.
The full write-up carries the risk that prompted the work, what was actually built, and how the outcome was measured.
2 companies
Where creative became the cross-functional center of gravity, without a change in mandate.
Without a function or person actively driving alignment, cross-functional initiatives fragment, stall, or compete for priority — a common failure mode in scaling organizations.
Built cross-functional relationships deliberately and positioned the creative function as the rallying point for core initiatives, without any change in formal authority or mandate.
Became the organizational center of gravity for core initiatives — the same authority-without-mandate pattern demonstrated in Co-Evolution, now repeated at a second company.
Playbook move — Authority follows clarity, not title.
The full write-up carries the risk that prompted the work, what was actually built, and how the outcome was measured.
10 ×
Faster marketing and product delivery time, with no added headcount.
Research, management, and design each ran on manual, high-friction workflows. Output was capped by individual bandwidth, and tool adoption was scattered project-by-project rather than embedded in how the org worked.
Deployed simple and pragmatic bits of AI capability across three distinct functions — research, management, and design — rather than as a point solution in one. Built the practice into daily operating cadence instead of treating it as a side experiment.
Increased capacity and output across research, management, and design without adding headcount. Marketing and Product delivery time is at least 10x faster now.
Playbook move — Make it a habit, not an experiment.
The full write-up carries the risk that prompted the work, what was actually built, and how the outcome was measured.
10 ×
Faster spec-to-deploy time, with design-to-engineering back-and-forth cut to near zero.
Design handoff to engineering created recurring back-and-forth — specs misread, technical constraints discovered late, iteration bottlenecked by translation loss between design and code.
Built front-end coding fluency directly into the design function (vibecoding), closing the Skeleton-to-Surface gap the Elements of UX framework identifies as a common source of rework. Design output is now technically pre-validated before it reaches engineering.
Cut design-to-engineering back-and-forth to near zero, removing a cost center from the delivery chain and shortening time-to-ship without adding engineering headcount. 10x faster spec-deploy time.
Playbook move — Know your material.
The full write-up carries the risk that prompted the work, what was actually built, and how the outcome was measured.
 Design practitioner
 Collaborators engaged
 Interfaces delivered