UX Research 101: Methods, Interviews and Usability Testing
A practical introduction to UX research: when to research, how to choose a method, run interviews and usability tests, and turn notes into insights.

You. The designer, or the person facilitating.

Other people. Users, colleagues, stakeholders.

Interface. Anything people act on or through: a sticky note, a document, a screen, a prototype. Drawn flat or tilted.
-
Environment. Where the action happens.
-
Transition. The move from one state to the next.
The diagrams in these courses use The Shape of Clarity, a small visual notation. Five shapes are enough.
Small labels or icons say what an interface holds: a question (?), an insight (!), ideas (a light bulb), a decision (a check mark). Speech bubbles and the chart symbol, for evidence, are added on top of the notation when needed; they are not part of it.
Read the notationContents
- About this course
- 1. The scene: people, interface, environment
- 2. Research in the loop: Understand and Test
- 3. What you can observe: say vs. do, why vs. how many
- 4. When to research (and when to push back)
- 5. Where research sits in the timeline
- 6. Two directions: top-down and bottom-up
- 7. Choosing a method
- 8. Triangulation
- 9. The pragmatic process: cast wide, then zero in
- 10. Three methods in practice
- 11. Synthesis: from observations to insights
- 12. Research as an operation: the loop inside a team
About this course
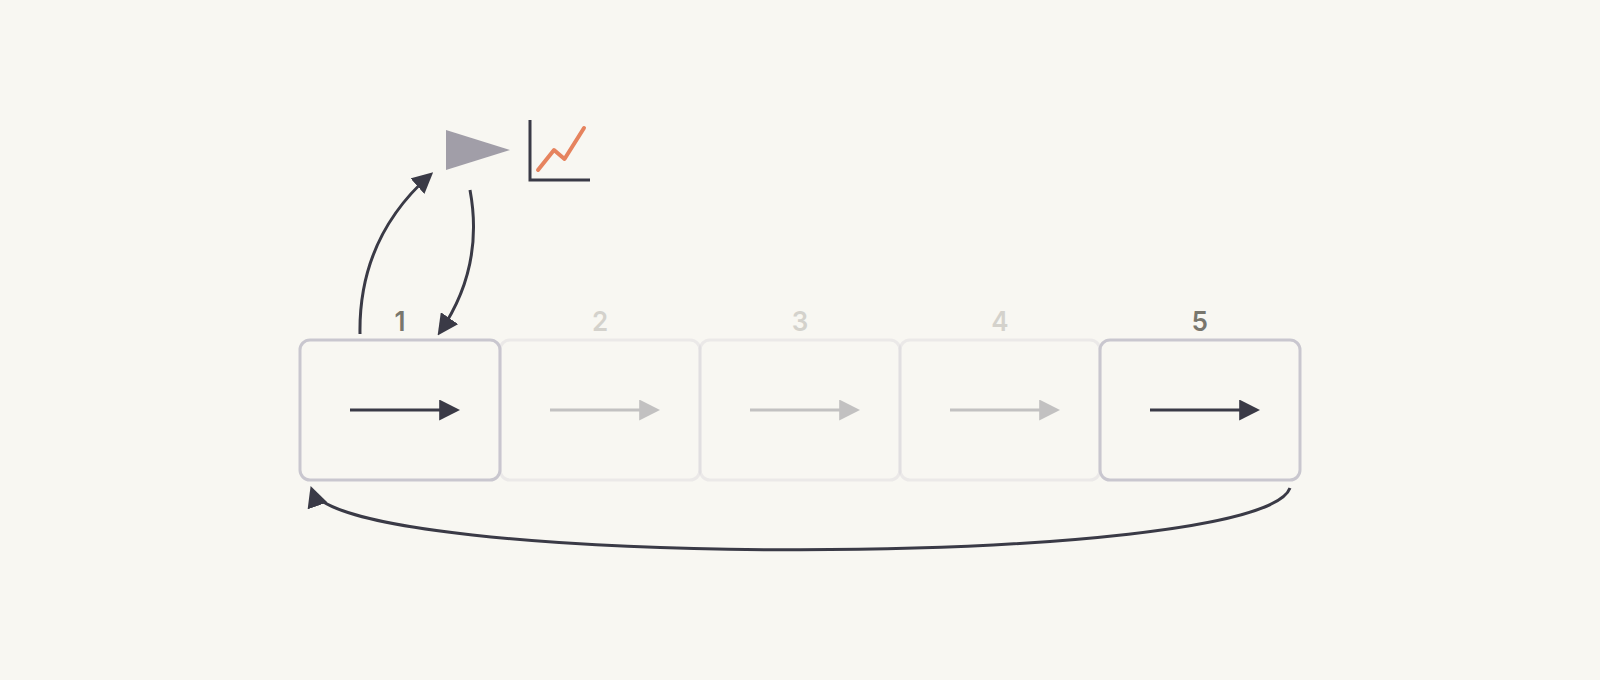
Research is how the design loop touches reality. Design Thinking 101 teaches that loop as five steps: Understand, Ideate, Decide, Prototype, Test. Research concentrates on two of them, Understand and Test, and the two are closely linked: testing a prototype is understanding again, and it closes the loop. In an evolve case, understanding often starts by testing the real product.
Every research method is a different way of looking at the same scene: people, an interface, an environment.
- Who it is for: anyone who needs to learn what people actually do and need before (and after) designing something for them.
- How it works: self-paced. Each section has a short explanation, a diagram, an exercise (Do), and readings (Read), data-oriented sources first.
- Your case: use the same digital product as in Design Thinking 101, either a build case (it doesn’t exist yet) or an evolve case (it exists and must change). Your findings will feed the design work.
- Out of scope: Figma, accessibility and performance are covered in UX Design 101.
The vocabulary used in this course:
- Observation: what you saw or heard.
- Finding: a pattern across observations.
- Insight: a finding plus its implication.
- Evidence: anything measurable or verifiable in reality. Tests produce it, and careful observation captures it while you are still understanding the problem.
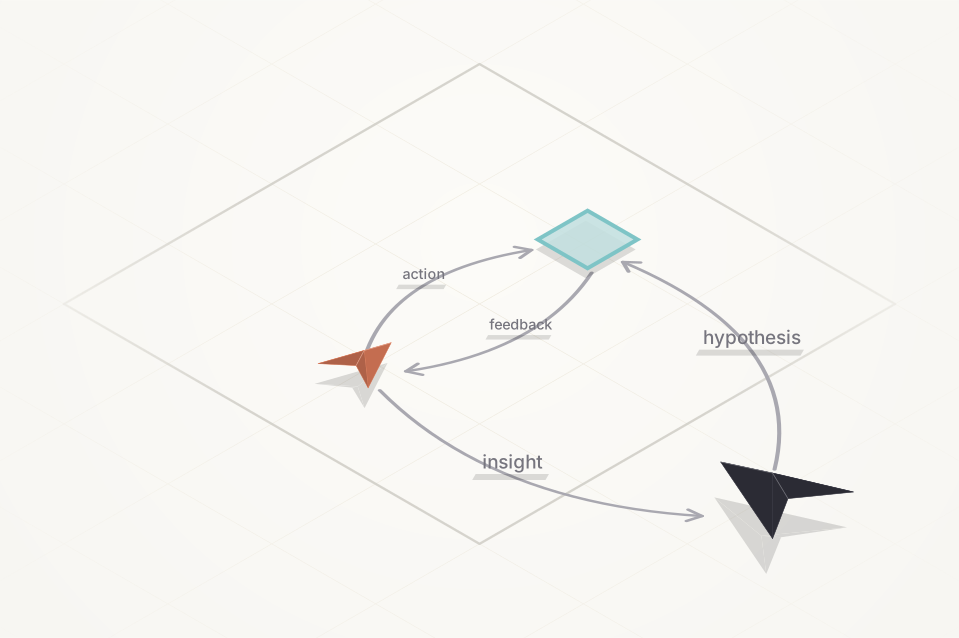
1. The scene: people, interface, environment
Every UX question is about three things: someone (a user) acting on something (an interface) somewhere (an environment). If you can’t name all three, you don’t have a research question yet.
Empathy starts here. It is the discipline of seeing the scene from the user’s position, not from yours.
Do. Pick an app you used today and draw the scene. Who else is in the environment?
Read.
- Norman (2013), The Design of Everyday Things, revised edition
- ISO 9241-210:2019, Human-centred design for interactive systems: the definition of context of use
- NN/g, Sympathy vs. Empathy in UX
2. Research in the loop: Understand and Test
There is one loop: the algorithm of Design Thinking 101. The designer steps outside the scene to understand it. The loop continues through Ideate, Decide and Prototype. Then Test brings the designer back to understanding the scene, which has now changed. Research is what happens at the two moments where the loop touches reality.
Do. Place your last project on the loop. Where did it stop?
Read.
- NN/g, UX Research Cheat Sheet (Farrell)
- Hall (2019), Just Enough Research, 2nd edition
- Design Thinking 101, section 2: the algorithm
3. What you can observe: say vs. do, why vs. how many
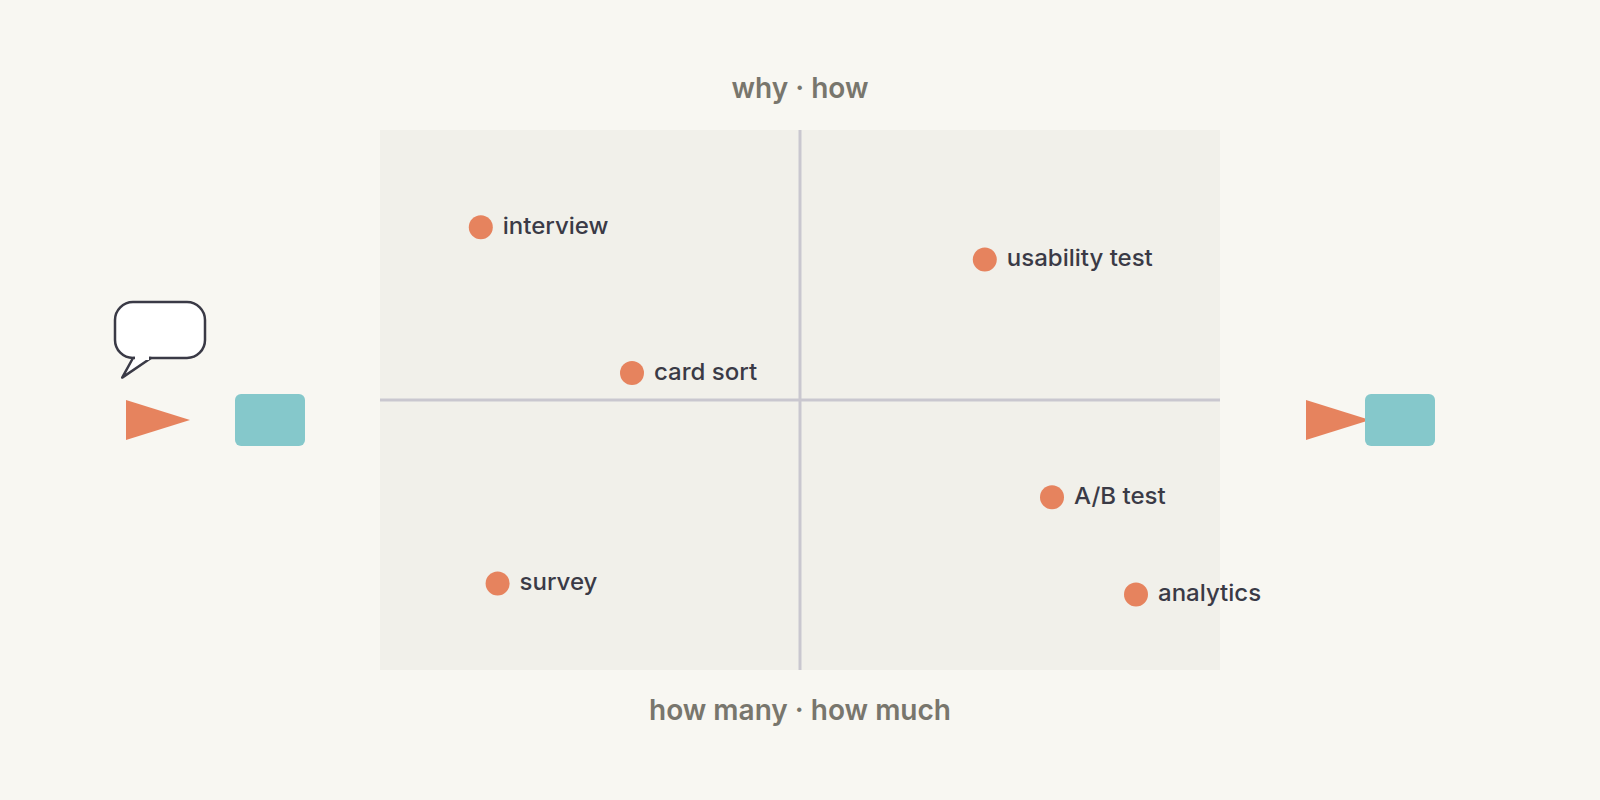
Two axes classify every method:
- Attitudinal vs. behavioural: what people say vs. what they do.
- Qualitative vs. quantitative: why and how vs. how many and how much.
When saying and doing disagree, trust doing.
Do. Place six methods on the map: interview, survey, analytics, usability test, card sort, A/B test. Which quadrant is empty in your practice?
Read.
- NN/g, When to Use Which User-Experience Research Methods (Rohrer)
- Nisbett & Wilson (1977), Telling More Than We Can Know, Psychological Review
- Fitzpatrick (2013), The Mom Test
4. When to research (and when to push back)
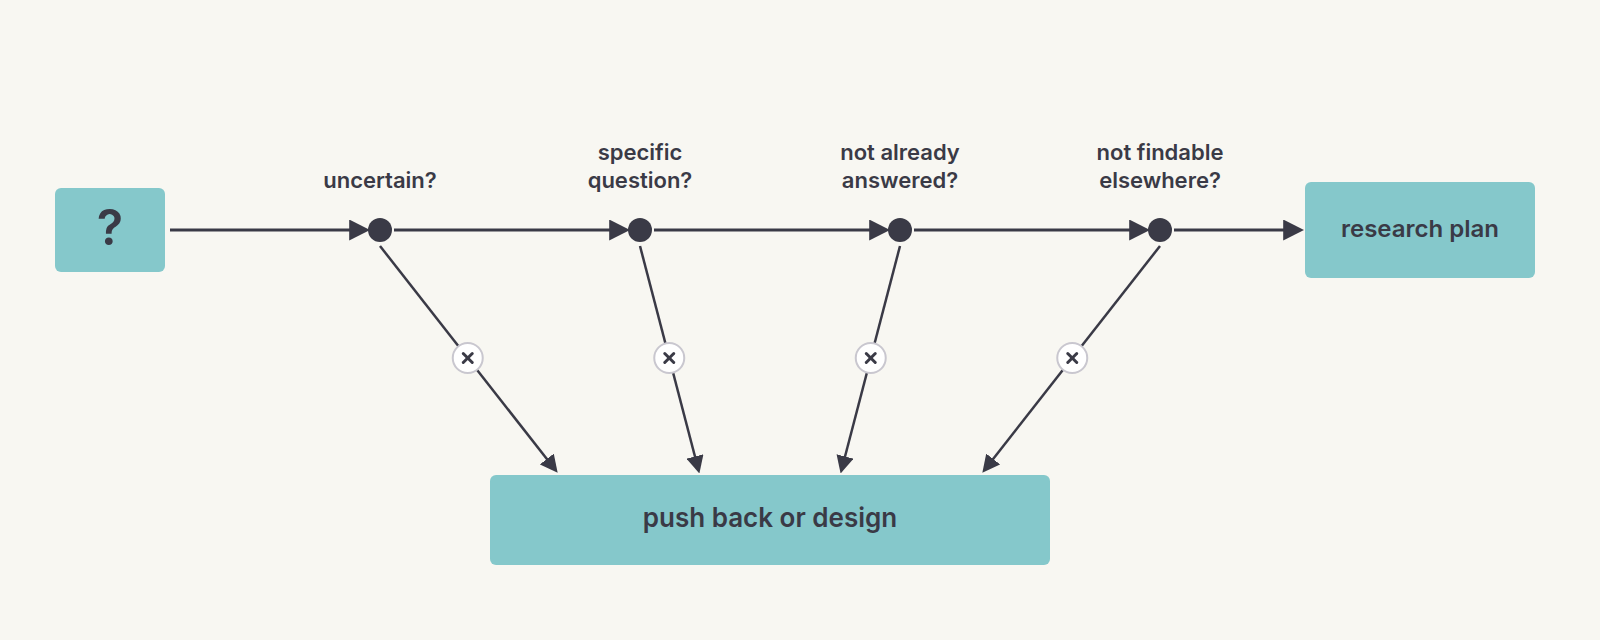
Research costs time. Only start it if all four are true:
- you are uncertain;
- you have a specific question;
- you haven’t already answered it;
- you can’t find the answer elsewhere.
Otherwise, push back or go straight to design.
In an evolve case, the cheapest first diagnosis is an expert review of the existing product against Nielsen’s heuristics (see UX Design 101, “Good vs. bad UX”). It tells you where to point the research.
Do. Rewrite three vague requests (such as “users hate the dashboard”) as specific research questions, and run each one through the four checks. Evolve case: first run a 20-minute heuristic pass on the existing product and list its three worst problems.
Read.
- GOV.UK Service Manual, Plan user research for your service
- Hall (2019), Just Enough Research, chapter 2
5. Where research sits in the timeline
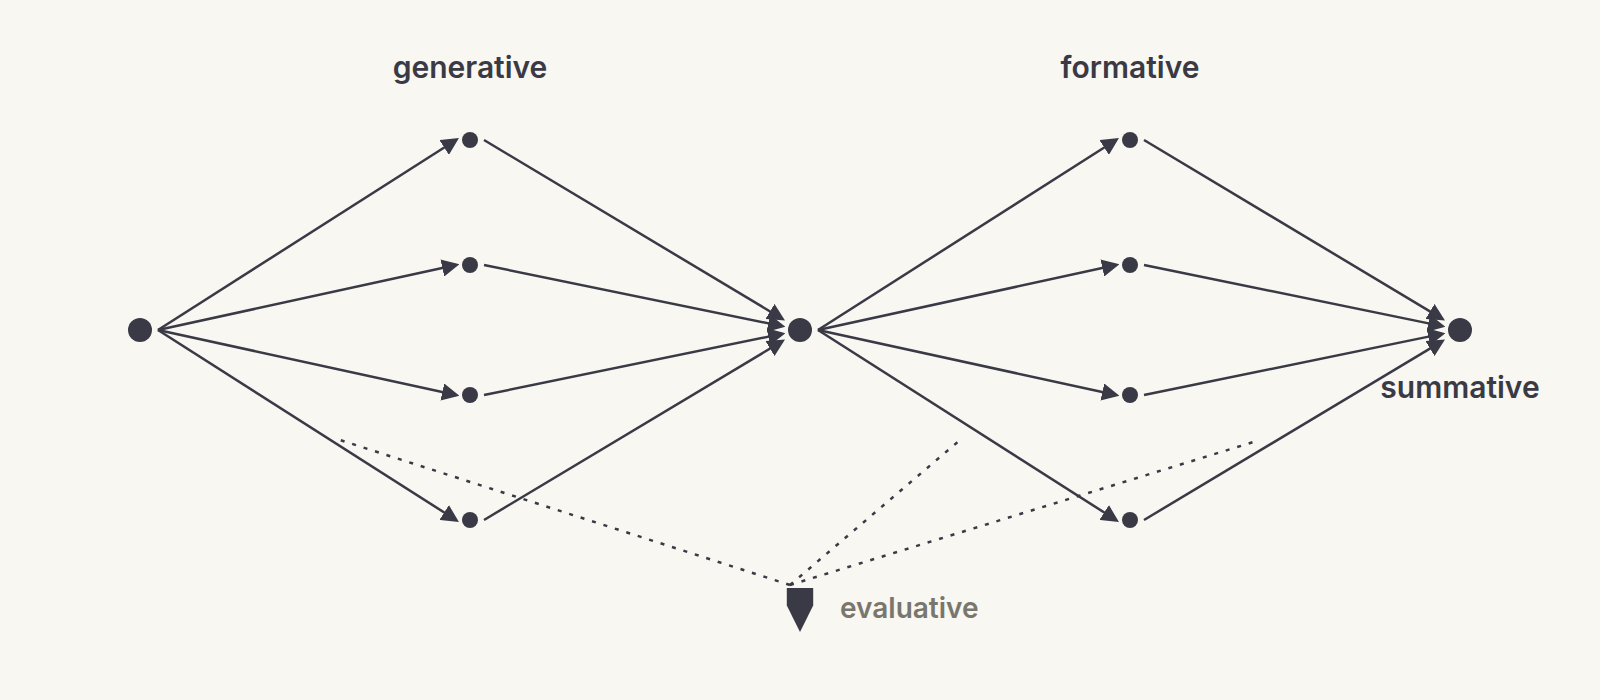
- Early research generates: it explores the problem.
- Mid-project research forms: it shapes the solution.
- Late research sums up: it measures the result.
- Evaluative research can happen at any time, on an existing product or on a prototype.
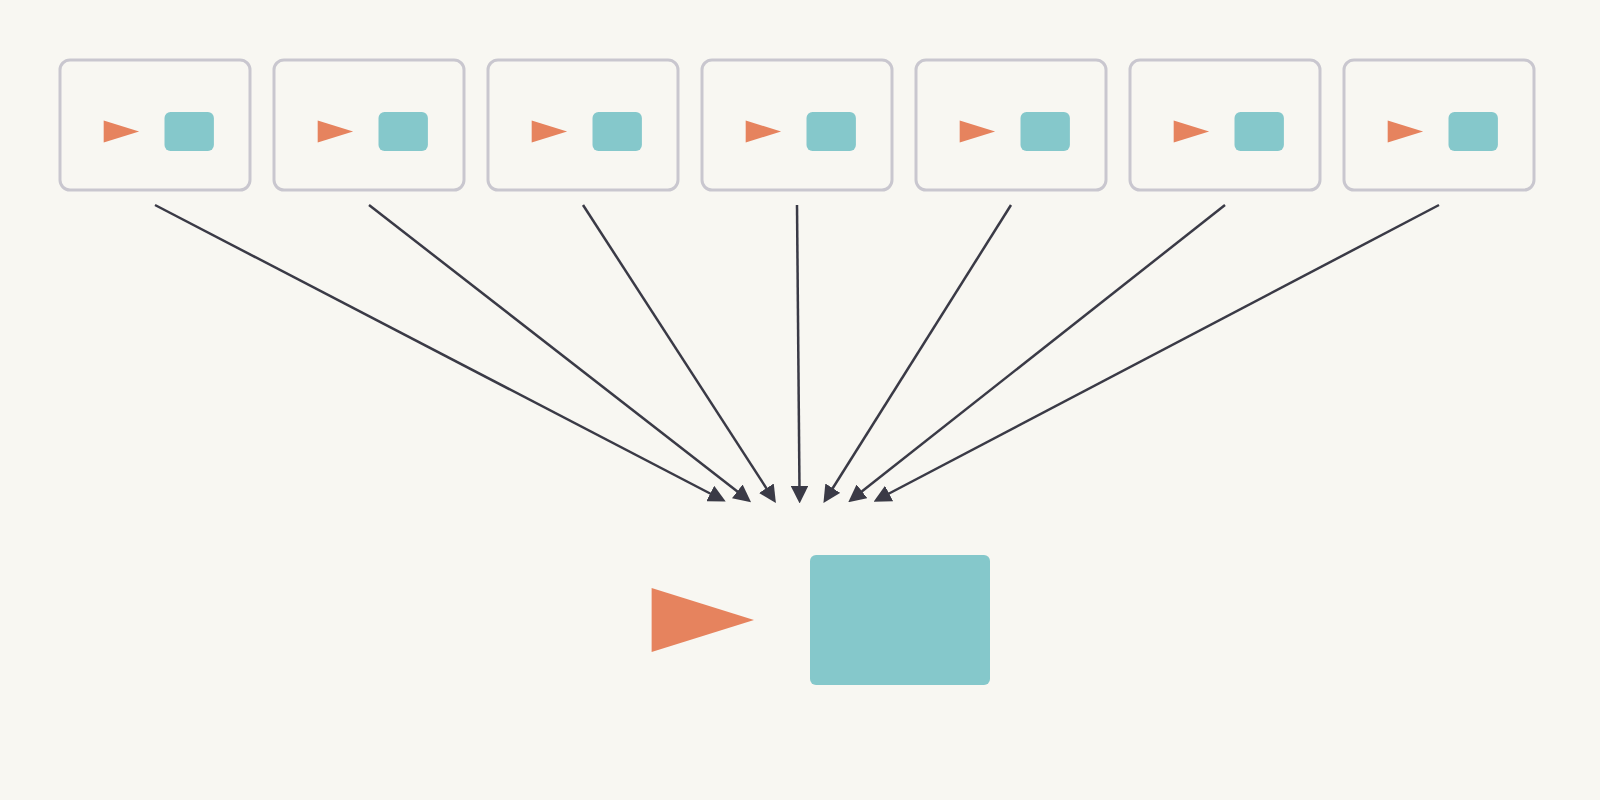
The Double Diamond draws the same idea twice: diverge, then converge. It is a composite of two moves: divergence (arrows leaving one point in different directions) and convergence (arrows meeting at one point).
Do. For your case, list which type of research you need this week and why.
Read.
- Design Council, The Double Diamond
- NN/g, Formative vs. Summative Evaluations (Joyce)
6. Two directions: top-down and bottom-up
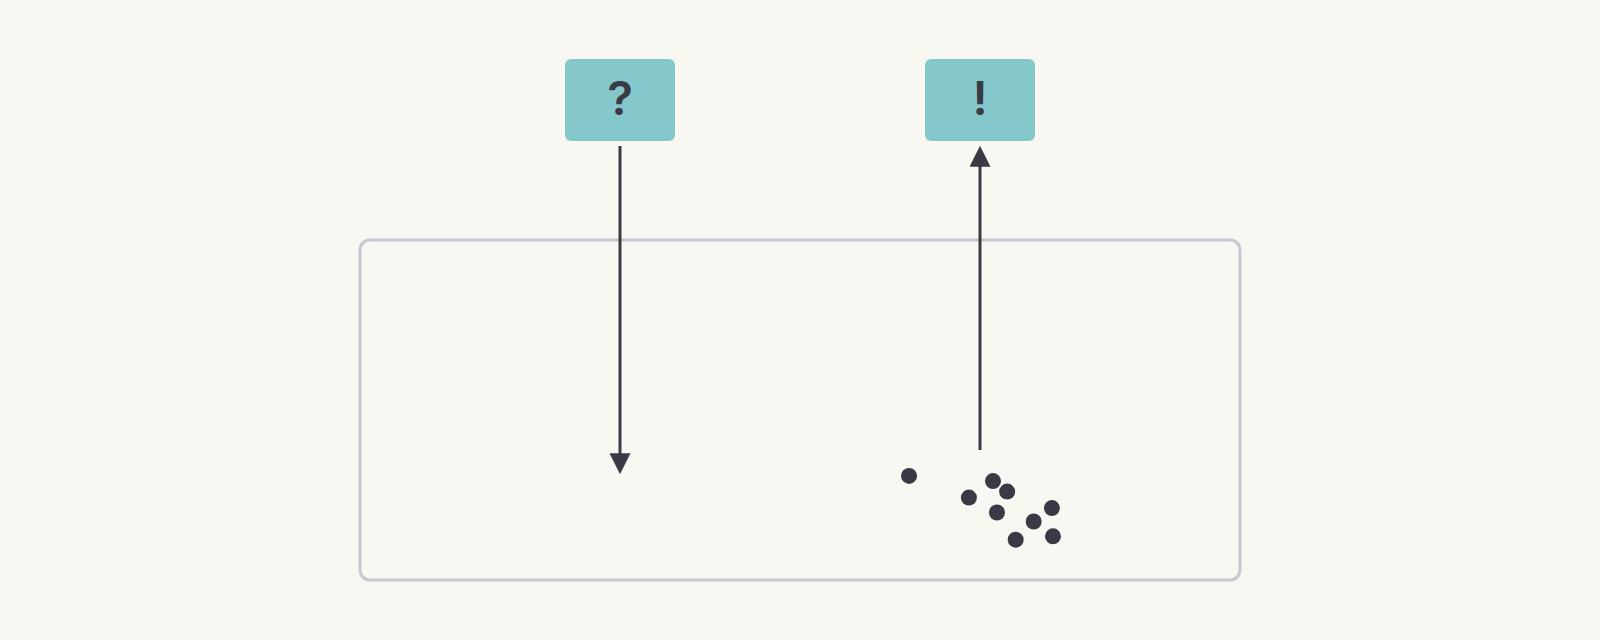
- Top-down: start from a hypothesis and check it against reality (deductive).
- Bottom-up: start from observations and let findings emerge (inductive).
Good research alternates between the two.
Do. Take one finding from your interviews. Was it a confirmed hypothesis or an emerging pattern?
Read.
- Glaser & Strauss (1967), The Discovery of Grounded Theory
- Braun & Clarke (2006), Using Thematic Analysis in Psychology, Qualitative Research in Psychology
7. Choosing a method
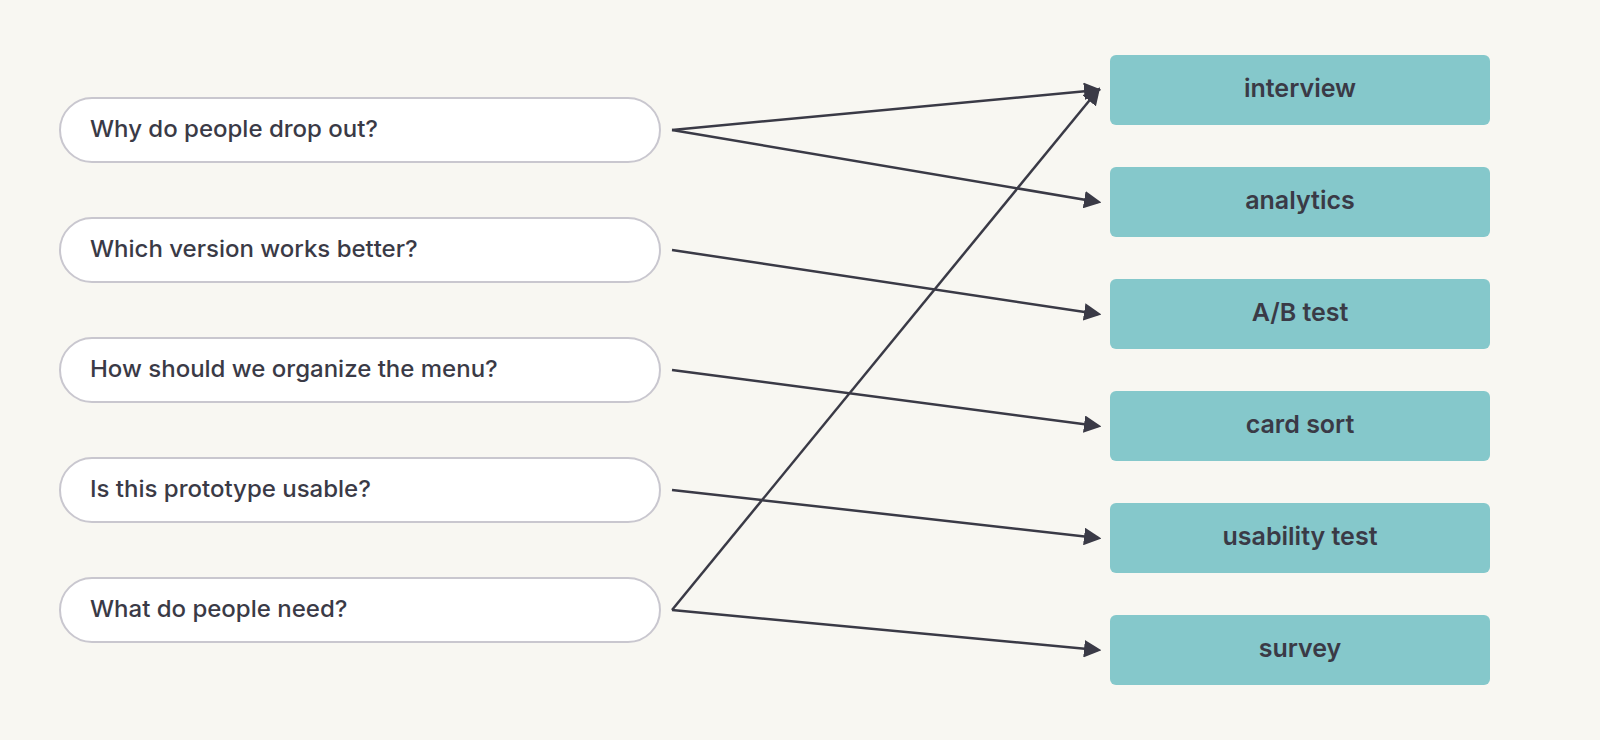
Start from the request, not from the method you like. Each type of question points to one method or a few.
Do. Take five requests from people you work with. For each one, pick a method and defend the choice in one sentence.
Read.
- NN/g, When to Use Which User-Experience Research Methods
- Goodman, Kuniavsky & Moed (2012), Observing the User Experience, 2nd edition
8. Triangulation
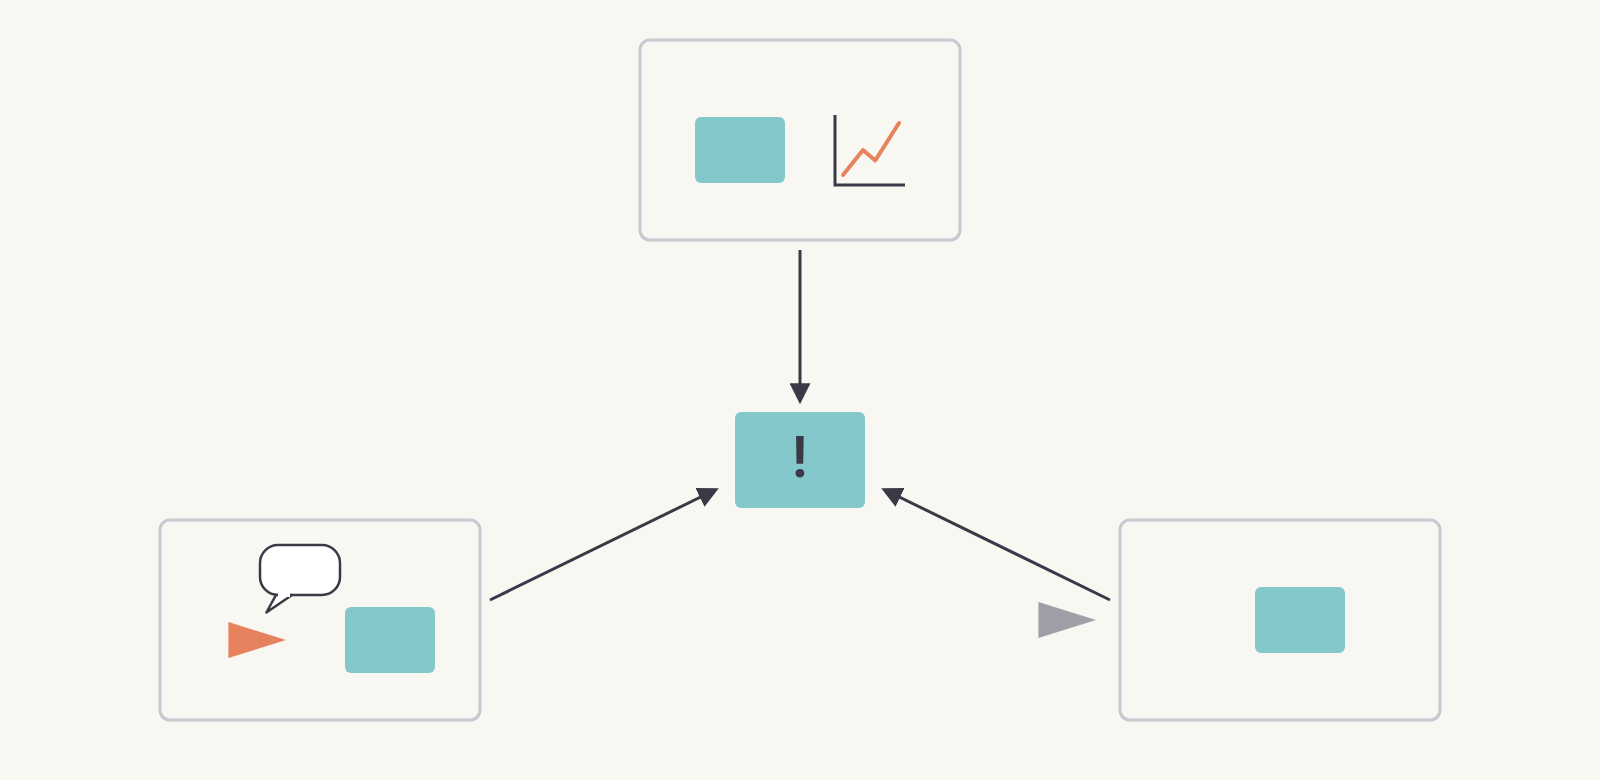
One method gives you one angle. Combining quantitative data, qualitative data and an expert review gives you a position you can trust.
Do. For one finding, name what the other two views would need to show to confirm it.
Read.
- NN/g, Triangulation: Get Better Research Results by Using Multiple UX Methods
- Denzin (1978), The Research Act
9. The pragmatic process: cast wide, then zero in
Start broad so you don’t miss the real problem. Then narrow down to the specific risk or opportunity worth a decision.
Do. Write a one-page research plan: question, method, participants, timeline, and the decision it should inform.
Read.
- Torres (2021), Continuous Discovery Habits
- GOV.UK Service Manual, User research

10. Three methods in practice
Interviews
Ask about past behaviour, not future intentions. Listen more than you talk. An interview is where empathy becomes practice: you borrow the user’s position for twenty minutes.
Do. Run a 20-minute interview about your case, in pairs if you can. Note five observations of behaviour, not opinions. Then fill in an empathy map (says, thinks, does, feels) and mark which quadrants you observed and which you inferred.
Read.
- Portigal (2023), Interviewing Users, 2nd edition
- NN/g, User Interviews 101 (Rosala)
- NN/g, Empathy Mapping: The First Step in Design Thinking (Gibbons)
Usability testing
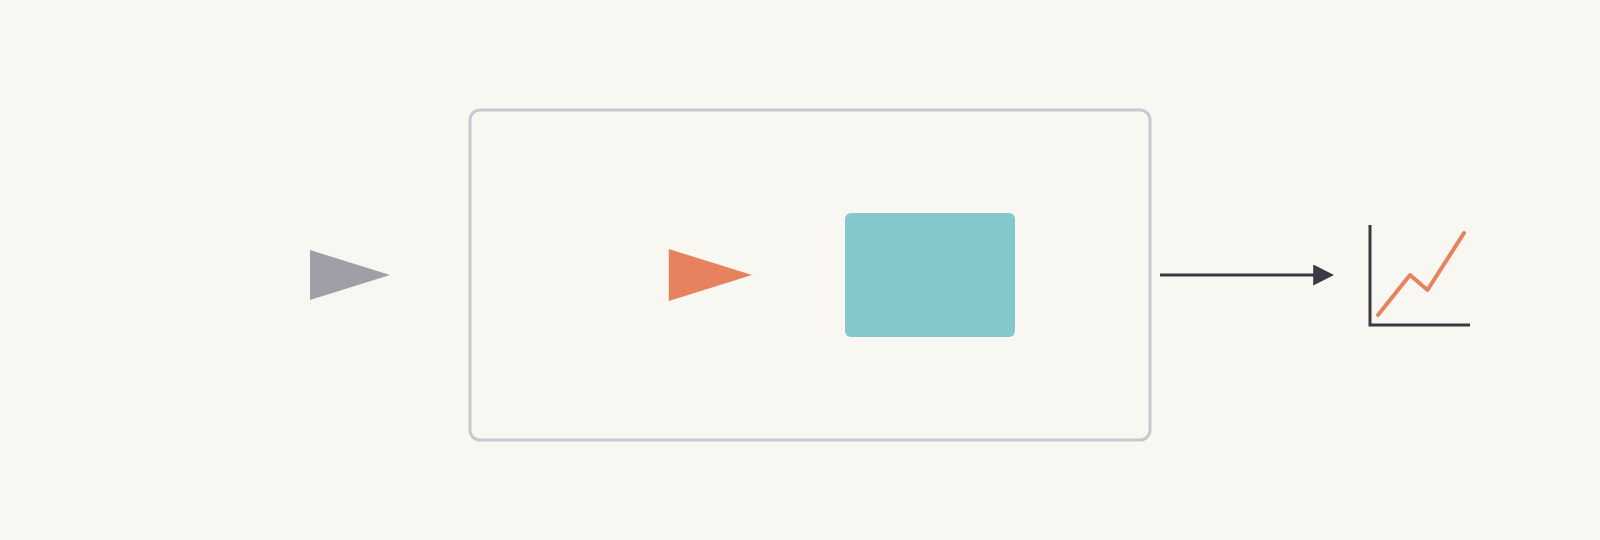
Give people a real task, watch, and don’t help.
How many people? The reference for qualitative testing is five per round: according to Nielsen, five users find most of the problems in one design iteration. Quantitative studies need at least 20 people. Regulated fields set formal minimums: the US FDA expects 15 participants per user group for medical-device validation.
One user is better than none: the first person already reveals about a third of the problems. The real trap sits at the two extremes, either not testing at all or over-investing in one big test instead of several small rounds.
Do. Test someone else’s prototype (or your own) with five people, or fewer if that is all you can get. Report the top three findings.
Read.
- Nielsen (2000), Why You Only Need to Test with 5 Users, NN/g
- Nielsen (2012), How Many Test Users in a Usability Study?, NN/g
- Nielsen & Landauer (1993), A Mathematical Model of the Finding of Usability Problems, INTERCHI
- US FDA (2016), Applying Human Factors and Usability Engineering to Medical Devices: see the section on validation sample size
- Krug (2010), Rocket Surgery Made Easy
Card sorting
People group your content, so your structure matches how they think about it.
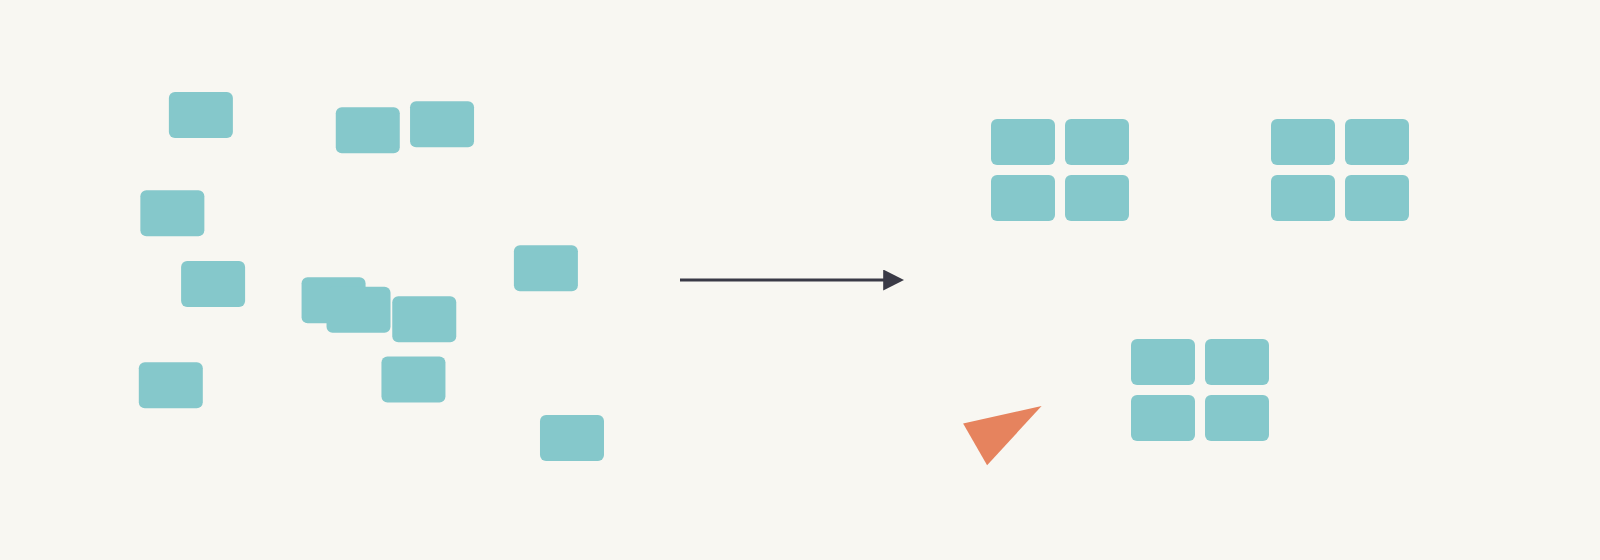
Do. Run an open card sort of 20 items with five people and compare their groupings. For a real study, NN/g recommends at least 15 participants per user group.
Read.
- Spencer (2009), Card Sorting
- NN/g, Card Sorting: Uncover Users’ Mental Models (Sherwin)
- Nielsen (2012), How Many Test Users in a Usability Study?, NN/g
11. Synthesis: from observations to insights
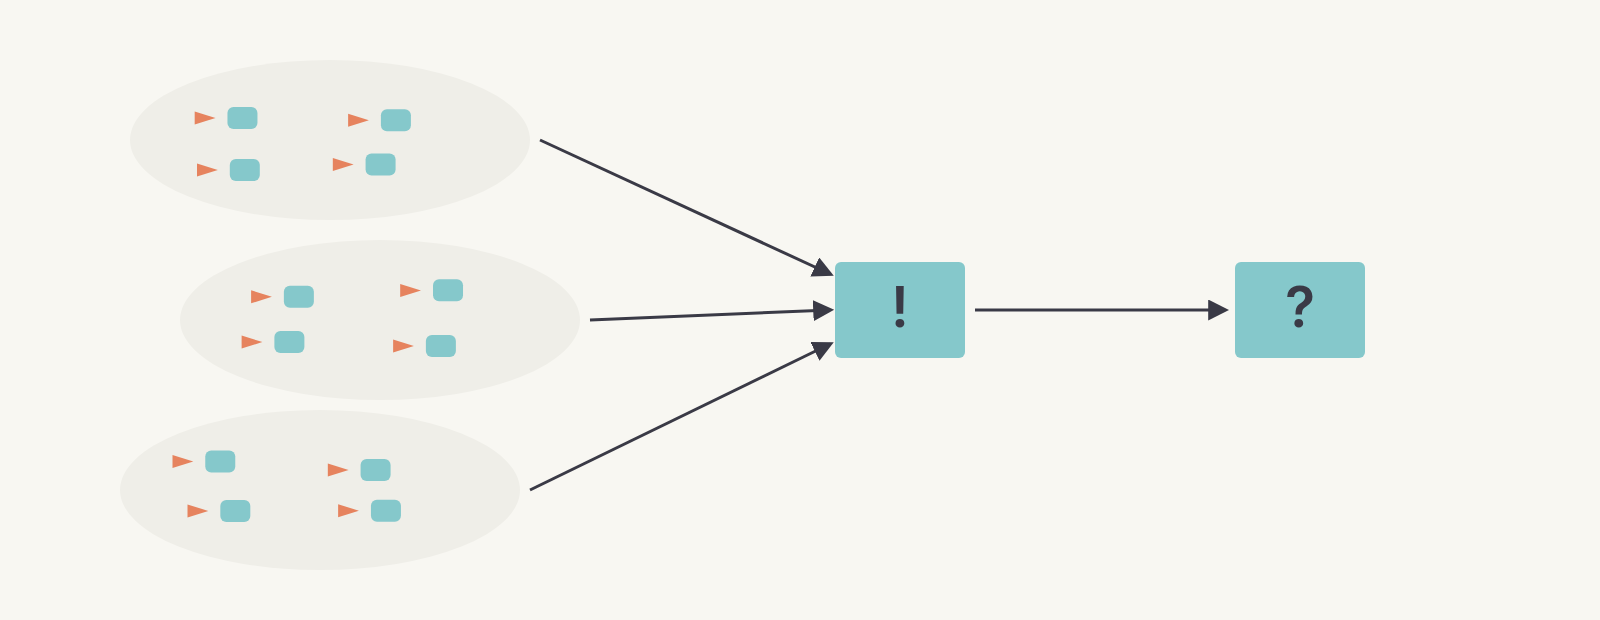
Raw notes are observations, not findings. Cluster your observations into findings (patterns), then add the implication: an insight is a finding plus its implication. An insight without an implication is trivia. Each insight becomes a “How might we…?” question for the Ideate step (Design Thinking 101, section 6).
Do. Make an affinity map of your interview notes and write three insights in the form “observations → finding → implication”.
Read.
- Braun & Clarke (2006), Using Thematic Analysis in Psychology, Qualitative Research in Psychology
- NN/g, Affinity Diagramming for Sorting UX Findings and Ideas (Pernice)
- Beyer & Holtzblatt (1998), Contextual Design
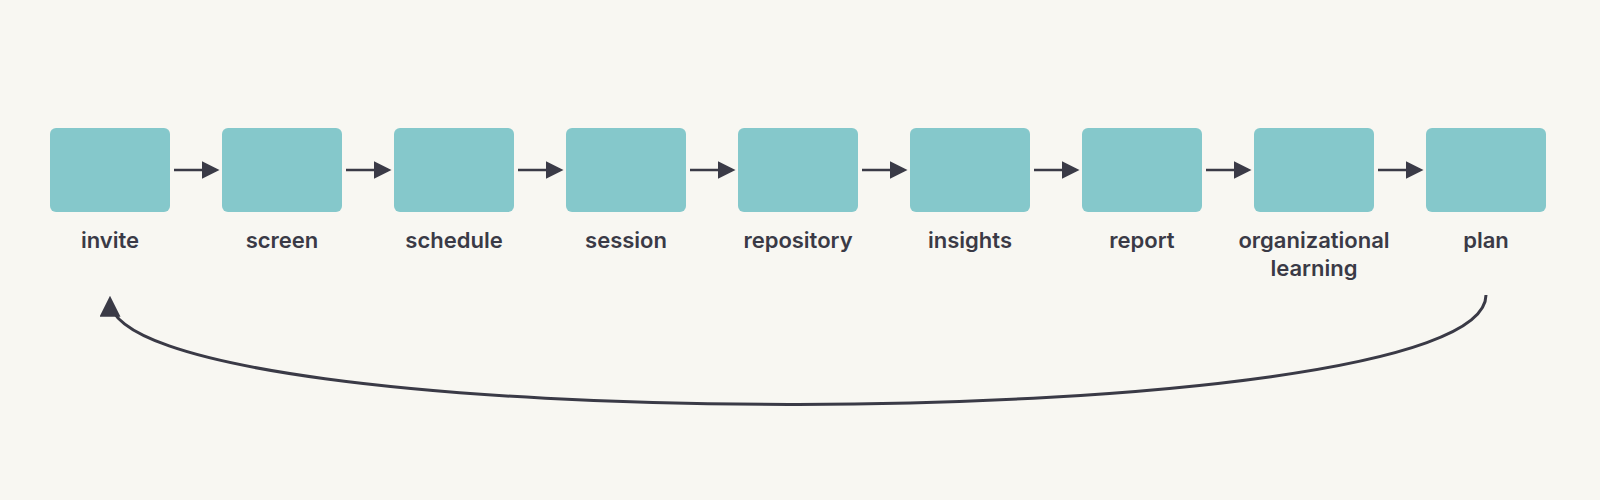
12. Research as an operation: the loop inside a team
In an organization, research is a repeatable pipeline: recruit, schedule, run sessions, store, synthesize, share, plan again. Its value compounds only if findings are stored and reused.
Do. Map how research moves (or doesn’t) in a team you know. Where does it leak?
Read.
- ResearchOps Community
- NN/g, ResearchOps 101 (Kaplan)
Bring clarity and structure to your team
The same method, applied to your organization: a fixed-scope diagnostic with one price, one timeline and a deliverable described up front.